Category
Home Values & Local Markets
Home Values & Local Markets guides on Easyabodefinder.

Home Valuation 101: What Actually Determines What Your House Is Worth
A home's value isn't one number. It's a range produced by whoever is estimating it, using whatever data they can see. An automated estimate reads public records and recent sales; an agent walks the rooms; an appraiser is paid to defend a figure a lender will lend against.
Maren Vickery · 9 min read

Renting vs. Buying: How to Run the Real Cost Breakdown for Your Situation
At the national median, buying costs more per month than renting right now: about $2,670 a month in principal, interest and property tax on a median-priced existing home, against a typical asking rent of $1,962. That gap of roughly $708 a month comes from a 7.28% 30-year fixed rate (Freddie Mac, 2026-10-01), a $429,100 median existing-home sale price (National Association of REALTORS, 2026-08) and a 0.9% average effective property tax rate (ATTOM, 2025).
Desmond Achebe-Park · 9 min read

Months of Supply, Explained: What This Number Means for Buyers and Sellers
Months of supply is the single number most agents, lenders and housing economists reach for when they want to describe the balance between buyers and sellers in one ZIP code, city or price band. It is simple arithmetic you can run yourself from local listing counts, and it changes what you should do about pricing, offer terms and timing.
Tobias Lindqvist · 6 min read
How to Find Your Home's Value: Comparing Online Estimators, CMAs, and Appraisals
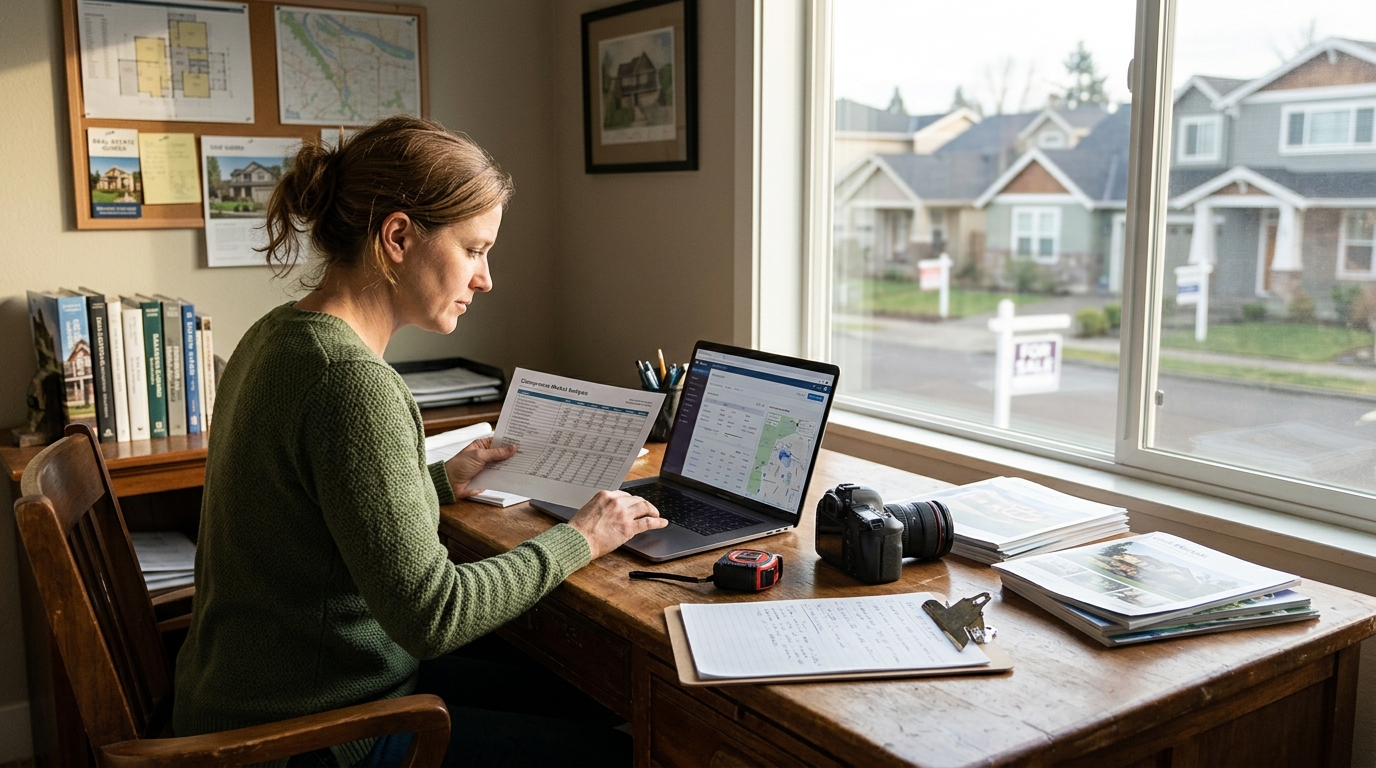
There are three common ways to put a number on a house: a free automated valuation model (AVM) like a Zestimate, a comparative market analysis (CMA) written by a real estate agent, and a licensed appraisal ordered by a lender. They cost different amounts, take different amounts of time, and carry very different weight in a transaction.
Desmond Achebe-Park · 9 min read

Comparing Home Prices and Affordability Between Two Cities: A Step-by-Step Framework
Comparing two cities on headline median price alone will mislead you. A $100,000 price gap can shrink to a $129 monthly gap once property tax rates, down payment size and closing costs are in the same spreadsheet — and it can also flip the other way. This guide gives you the four metrics to pull, the rule for dating them, and the arithmetic to run once you have them.
Maren Vickery · 10 min read

Big City vs. Suburb: How to Compare Housing Markets When Prices Don't Tell the Whole Story
The headline price difference between a city neighborhood and a suburb usually hides three things: square footage, the property tax rate on each side of the municipal line, and what today's mortgage rate does to a larger loan. Redfin's national four-week read (reported by National Mortgage Professional, undated) put urban homes at $310,000 and suburban homes at $385,000 — a $75,000 gap — yet suburban price per square foot, $206, was only $1 above urban, at $205.
Odalys Reyes Fontaine · 10 min read

Understanding Price Per Square Foot: How It's Calculated and Why It Can Be Misleading
Price per square foot turns a sale price into a per-unit figure so homes of different sizes can be lined up side by side. It is the quickest sanity check a buyer or seller has, and also the easiest number to misread, because the square footage half of the fraction is measured differently by different people and the price half reflects things square footage never captures — lot, condition, view, floor plan, HOA dues.
Desmond Achebe-Park · 7 min read

What Is My Home Worth? How to Get an Accurate Value Without Overpaying for an Appraisal
There are three practical ways to put a number on a house: a free online automated valuation model (AVM), a comparative market analysis (CMA) from a real estate agent, and a licensed appraisal. They cost between nothing and a few hundred dollars, take between seconds and a few weeks, and disagree with each other more than most owners expect.
Tobias Lindqvist · 9 min read

Is It a Good Time to Buy a Home in Your Local Market? How to Read the Signals
There is no national answer to "is now a good time to buy." The figures that decide it — median sale price, how long listings sit, how many are for sale, and what direction prices moved over the past year — are measured metro by metro, and they can point opposite ways in two submarkets ten miles apart.
Odalys Reyes Fontaine · 11 min read

How to Read a Local Housing Market Report: Prices, Trends, and What to Watch
A local housing market report is only useful if you know which numbers in it are measurements, which are estimates, and which month each one actually describes. Four figures do most of the work: median sale price, median days on market, inventory or months of supply, and the year-over-year price change — each from a named source, each with a data month attached.
Priya Natarajan-Wells · 12 min read

What Is a Comparative Market Analysis (CMA) and How Does It Affect Home Values?
A comparative market analysis is the pricing report an agent hands you before you list, or before you write an offer. It takes recently sold homes nearby, adjusts their prices up or down for differences in size, bedrooms and features, and uses the result to estimate what your home would likely sell for now.
Priya Natarajan-Wells · 7 min read

Neighborhood Home Values: How to Track What's Happening Street by Street
Tracking home values street by street means ignoring national headlines and going straight to the published series for your market: Redfin's city and neighborhood pages, Unlock MLS/Austin Board of Realtors inventory reports, FHFA's metro price index, and Census building-permit data. Each is measured differently, released on a different schedule, and covers a different geography — which is why two "Austin median price" figures can disagree without either being wrong.
Tobias Lindqvist · 11 min read